Accessible participation
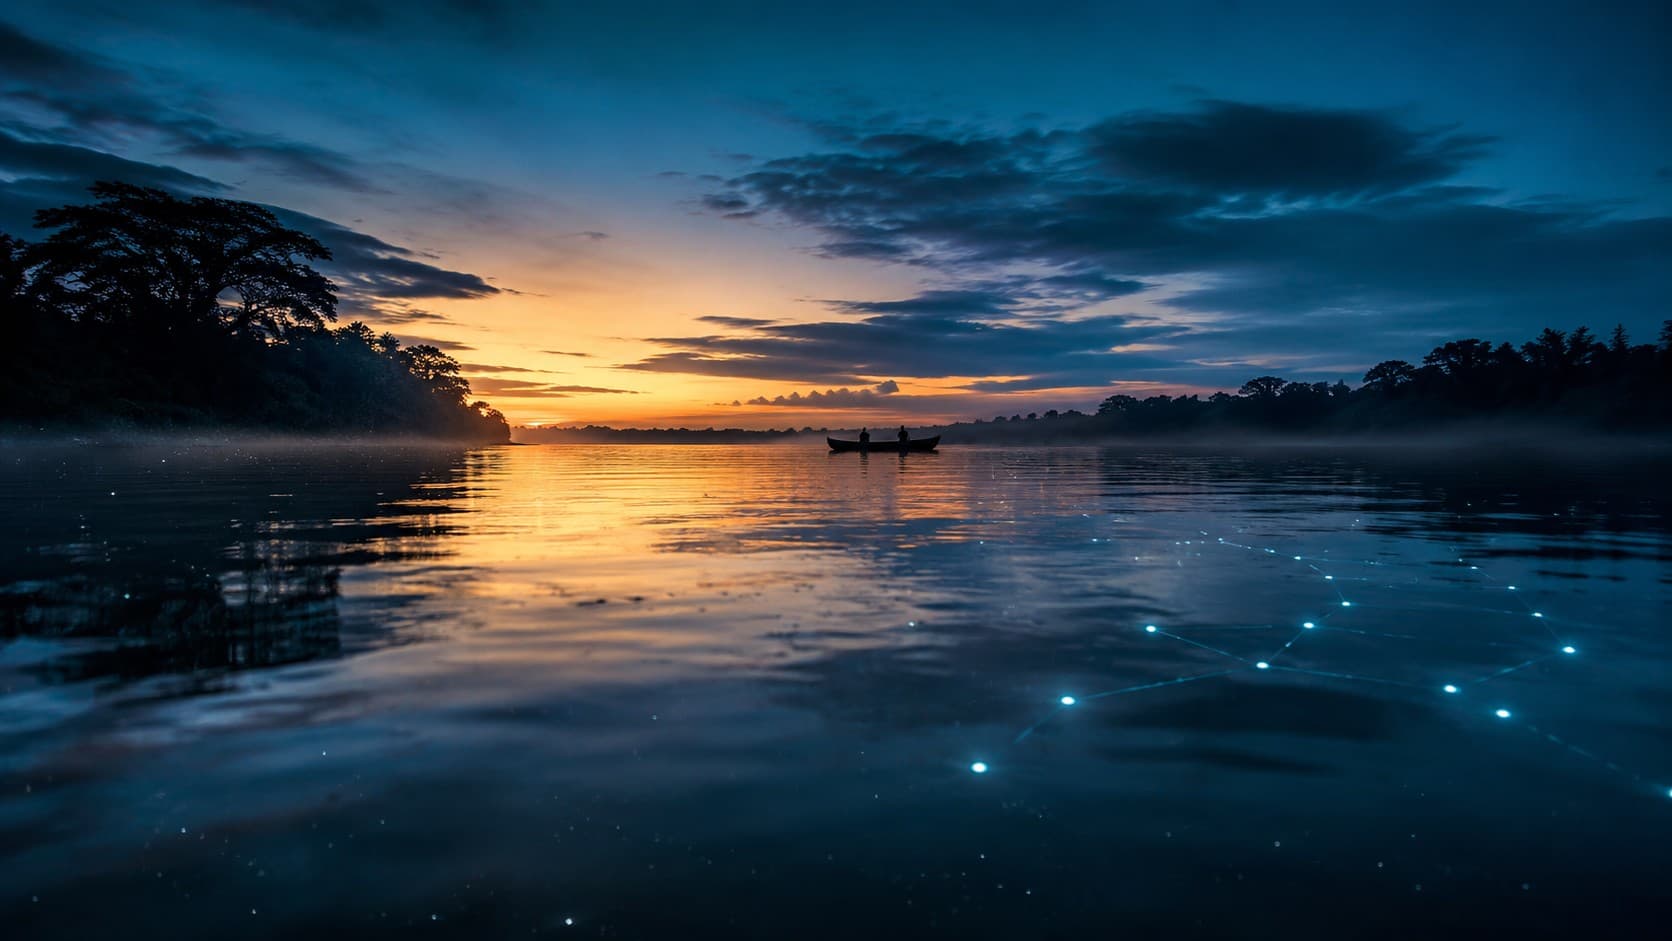
Text, voice messages, photos and location make data collection fit the routines of people who live and work in the area.
Participatory environmental monitoring
We connect the knowledge of fishers and local communities with the decisions researchers and managers make. Using WhatsApp and artificial intelligence, we organize field data for research, conservation and environmental management.
The challenge
Fisheries and environmental monitoring programs often rely on paper notes, infrequent field visits and small teams covering large areas. The knowledge of people who are there every day rarely reaches decision-makers in a structured form.
The result is fragmented data that cannot inform public policy, scientific research or environmental management as often as the area needs.
Today
With Syncorp
What your organization gets
Syncorp brings together WhatsApp data collection, organized records and indicator dashboards. Your organization's monitoring program is the starting point.
Text, voice messages, photos and location make data collection fit the routines of people who live and work in the area.
Records linked to the project and activity locations make it easier for teams to review and retrieve information.
Dashboards and indicators help teams track activity and turn records into useful knowledge.
In our first conversation, we work together to define the area, participants, variables and indicators needed to scope the implementation.
How it works
Participants send text, voice messages, photos or location through WhatsApp. Data collection uses a familiar channel, with no additional app to install or dedicated sensors to purchase.
Artificial intelligence interprets reports and organizes details such as species, quantity, date and location according to the project's variables.
Records are organized by project and area. Teams can review information and resolve outstanding issues before using it in their analyses.
Researchers and managers consult records and indicators in the dashboard to track activity, understand the area and inform decisions.
Field experience
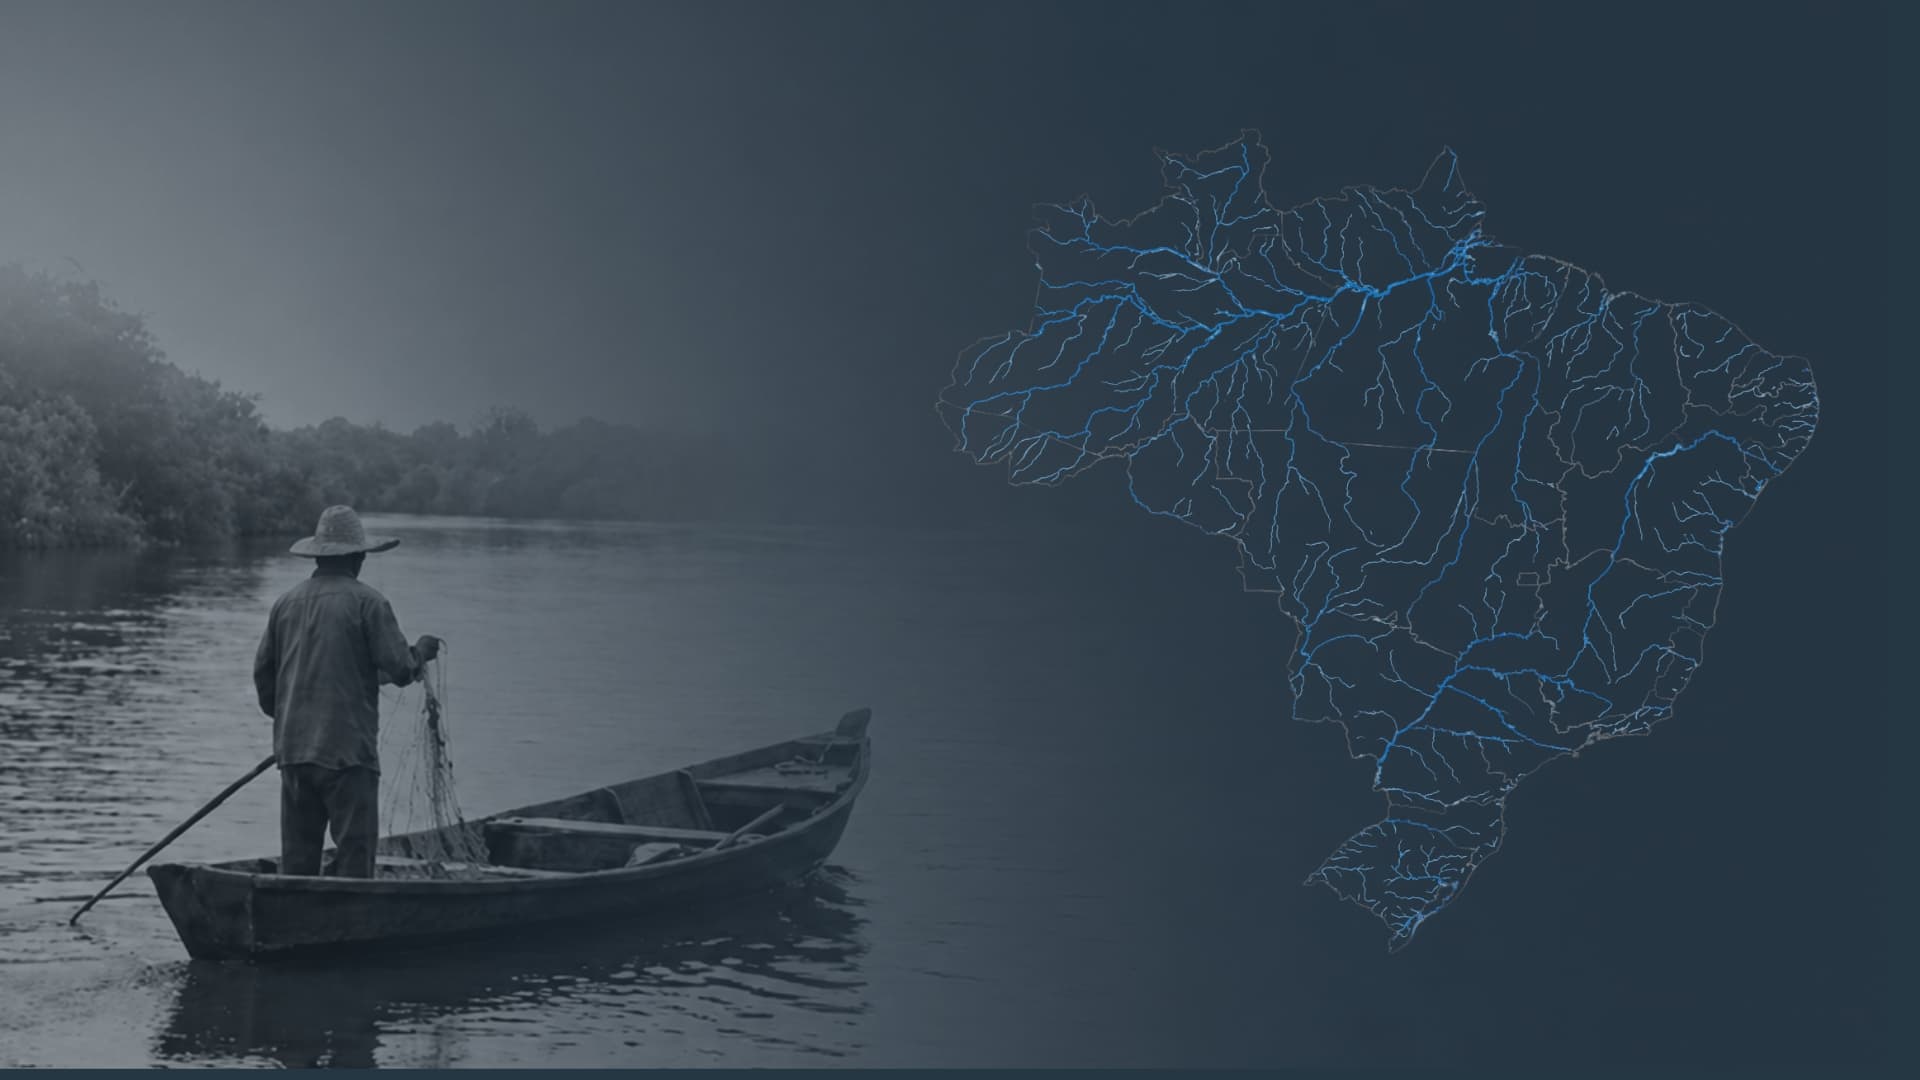
Through a research and development partnership with the Instituto de Pesca do Estado de São Paulo, we apply the platform to participatory inland fisheries monitoring. Reports sent by fishers through WhatsApp feed into records of catches, fishing effort and activity locations.
This experience brings together technology, research and local knowledge. It guides the platform's development and its adaptation to new areas and monitoring programs.
Area
Inland fisheries in São Paulo, Brazil
Scientific partnership
Instituto de Pesca do Estado de São Paulo
Collection channel
WhatsApp: text, voice messages and photos
The same infrastructure, new areas
Our experience in fisheries opens the way to new applications. Each project requires adapting collection protocols, variables and indicators with the organization responsible. The areas below represent potential applications.
Monitoring wildlife, plants and habitats across different ecosystems.
Data to support sustainable value chains and forest-based enterprises.
Tracking threatened species and conservation programs.
Producing environmental indicators for management and public policy.
Social and environmental traceability and structured data throughout the value chain.
Who we serve
Environmental and fisheries monitoring programs in the areas they manage.
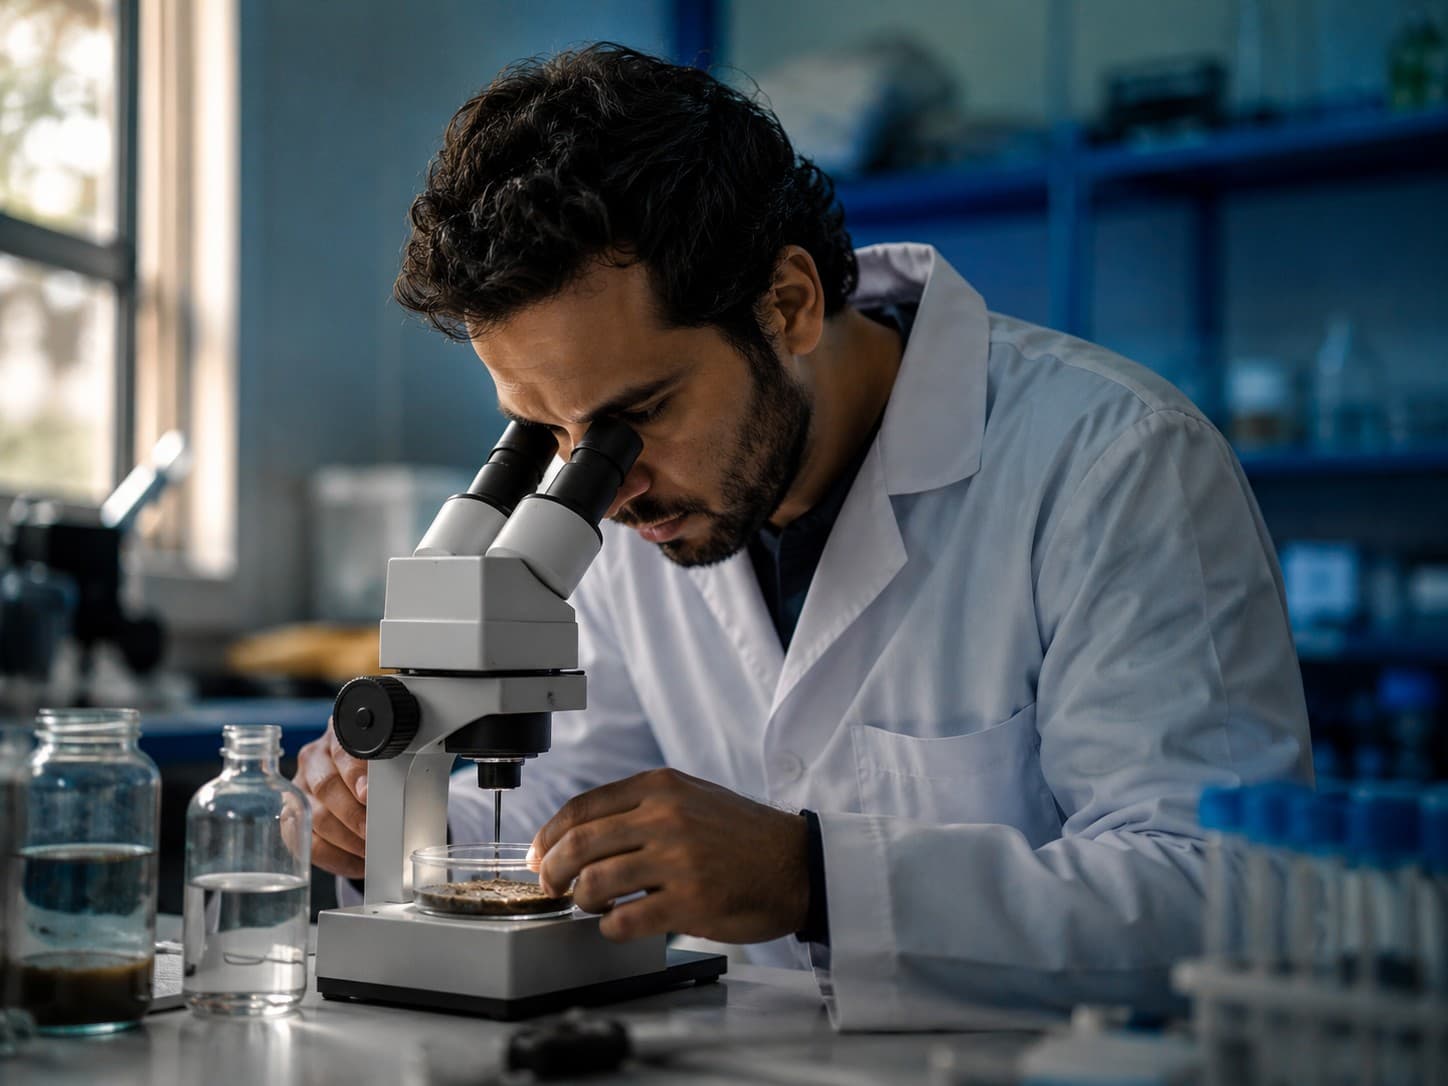
Structured field data for scientific research and public policy.
Indicators to track conservation and bioeconomy programs.
Organizing data and evidence to support environmental monitoring and value chain programs.
Contact
Book a demo and tell us about your project: the area, participants, data requirements and monitoring objectives.